
Running the Simulation Spreadsheet
You now have everything you need to simulate the roll of the dice. To begin the simulation click on the Simulation button on the the toolbar. The following window appears:

If you want to supply a different name than what is shown change it (this allows you to keep track of different iterations of a model) otherwise click Ok. When you do another box appears
The output from the simulation will be placed on a separate sheet, you can accept the default name or change it then Click Ok.

FinPak can only handle numeric output, the only non-numeric answer it understands the Excel value NA(), this is a function not just "NA()" typed in a cell. You should make sure that model produces values within this acceptable range. You can assign a numeric error code if you like, but it must be unique. For the dice we know they are incapable of producing negative numbers thus we could use a negative if we wished. In this case just click ok since there is no reasonable chance of an error valuing occurring. (See Error Checking). So just click Ok.
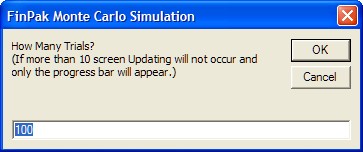
The next box wants to know how many times the simulation should be run. The default value of 100 is almost always too small for good results. But it is sometimes a good idea to run the simulation for just a few runs just to see if everything works as expected.
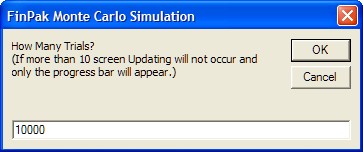
In our case let's run it enough so that we get meaningful results, maybe 10,000 times. The upper limit is 65,000 trials for Excel versions 11 (Excel 2003) and below and 1,000,000 for Excel 12 (Excel 2007) and above, this can be extended by using the Combine feature which is probably a better idea for large simulations.
Once you click Ok the following appears on a new sheet called: Result (unless you changed the default name):
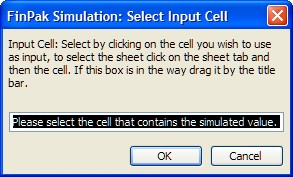
At this point you navigate to the sheet (click on the sheet name) that has the cell you want to simulate and click on that cell.
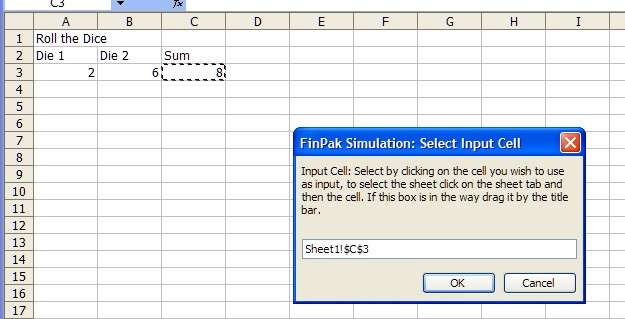
In this case that is the sum of the dice toss cell C3. When you click Ok the following appears:
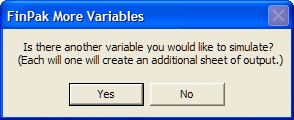
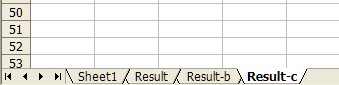
You can keep track of up to twenty variables. So if you wanted to also see what the value of each die was then you would click yes and a new sheet using the sheet name from above with a "-b" appended. If we keep track of both dice then you see the following sheets in the workbook.
Once you click no or you have chosen your 20th variable the following box will appear, it will show you that it is formatting the output sheets.

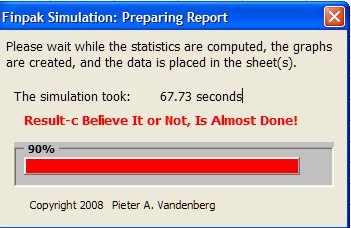
Once that is completed the simulation will start and the following progress bar will appear
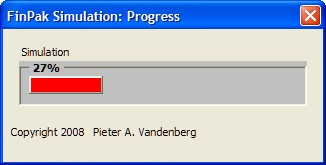
to let you know how far it has progressed. Underneath you will see the output sheet.
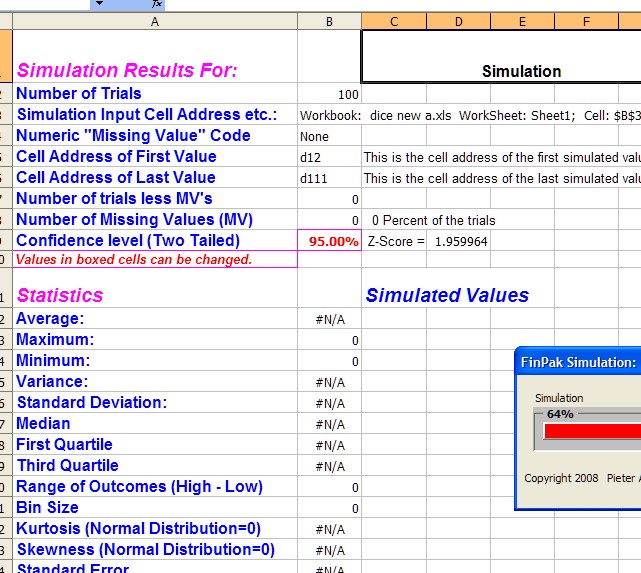
Notice that all of values are basically set to Not Available. To speed things up they will not be update until after the simulation completes. When the simulation completes the following will appear, one for each sheet. Notice that this is the one for Result-C, which is the third sheet.
When it is done the output sheet(s) will be filled in and the graphs completed. This is a live sheet. You can look at the formulas to see how the values were computed.
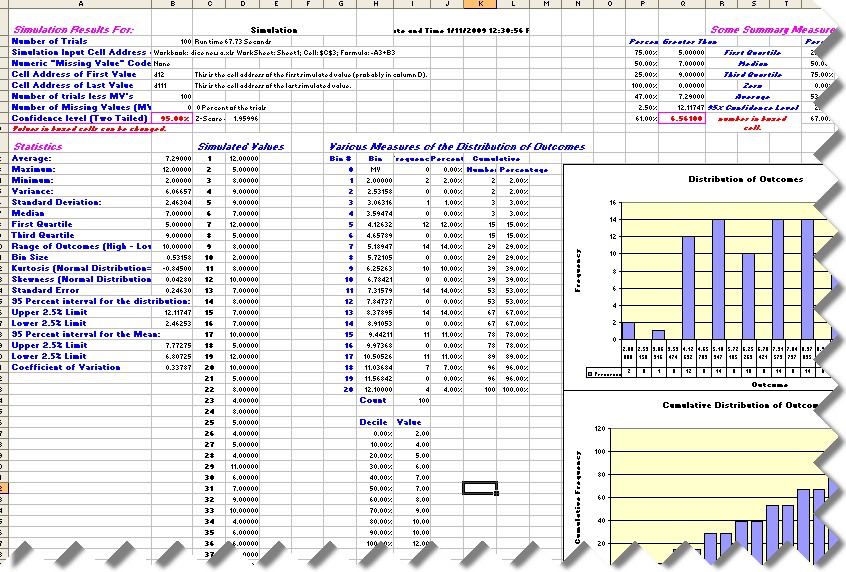
This output is discussed in detail in the next section.
Copyright © 2009 Pieter Vandenberg