Triangle Distribution1
FSTriangleinv(low, Likely, High, Optional Random Number)
This is the form of the triangle distribution function. Three values need to be entered in the function. You can supply either the numbers or the cell addresses of the numbers. The random number input is optional and if none is supplied the function will supply the random number.
Like all functions you can enter the requested inputs directly in the function or you can refer to cell addresses and you do not have to supply the optional inputs.
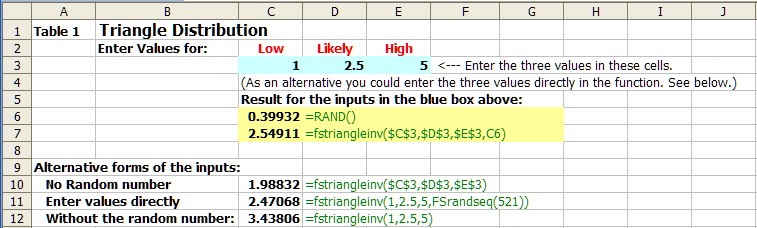
Table 1 below is a snippet of a spreadsheet that demonstrates various ways to enter and use FSTriangle. The formula is shown in green next to cell which actually contains the formula.
The low and most likely and high are entered in the blue cells. In this case the results in the yellow box shows that the optional random number was entered (in this case C6 = .1183) and the random selection from the this distribution is shown in C7. And of course each time the spreadsheet is recalculated a new sample is drawn.
Cell C10 to C12 show other input options. The C10 shows the result when the random number is left out, in this case FinPak supplied a random number which resulted in value of 3.82102. In cell C11 the input parameters were entered into the formula directly, and a random number was supplied using the FSrandseq(). This means that sequence of random numbers in this cell will be repeated for each simulation that is run, or whenever "reset" is pressed on the FinPak toolbar. In cell C12, perhaps the simplest, the numbers are entered directly and no random number was supplied.
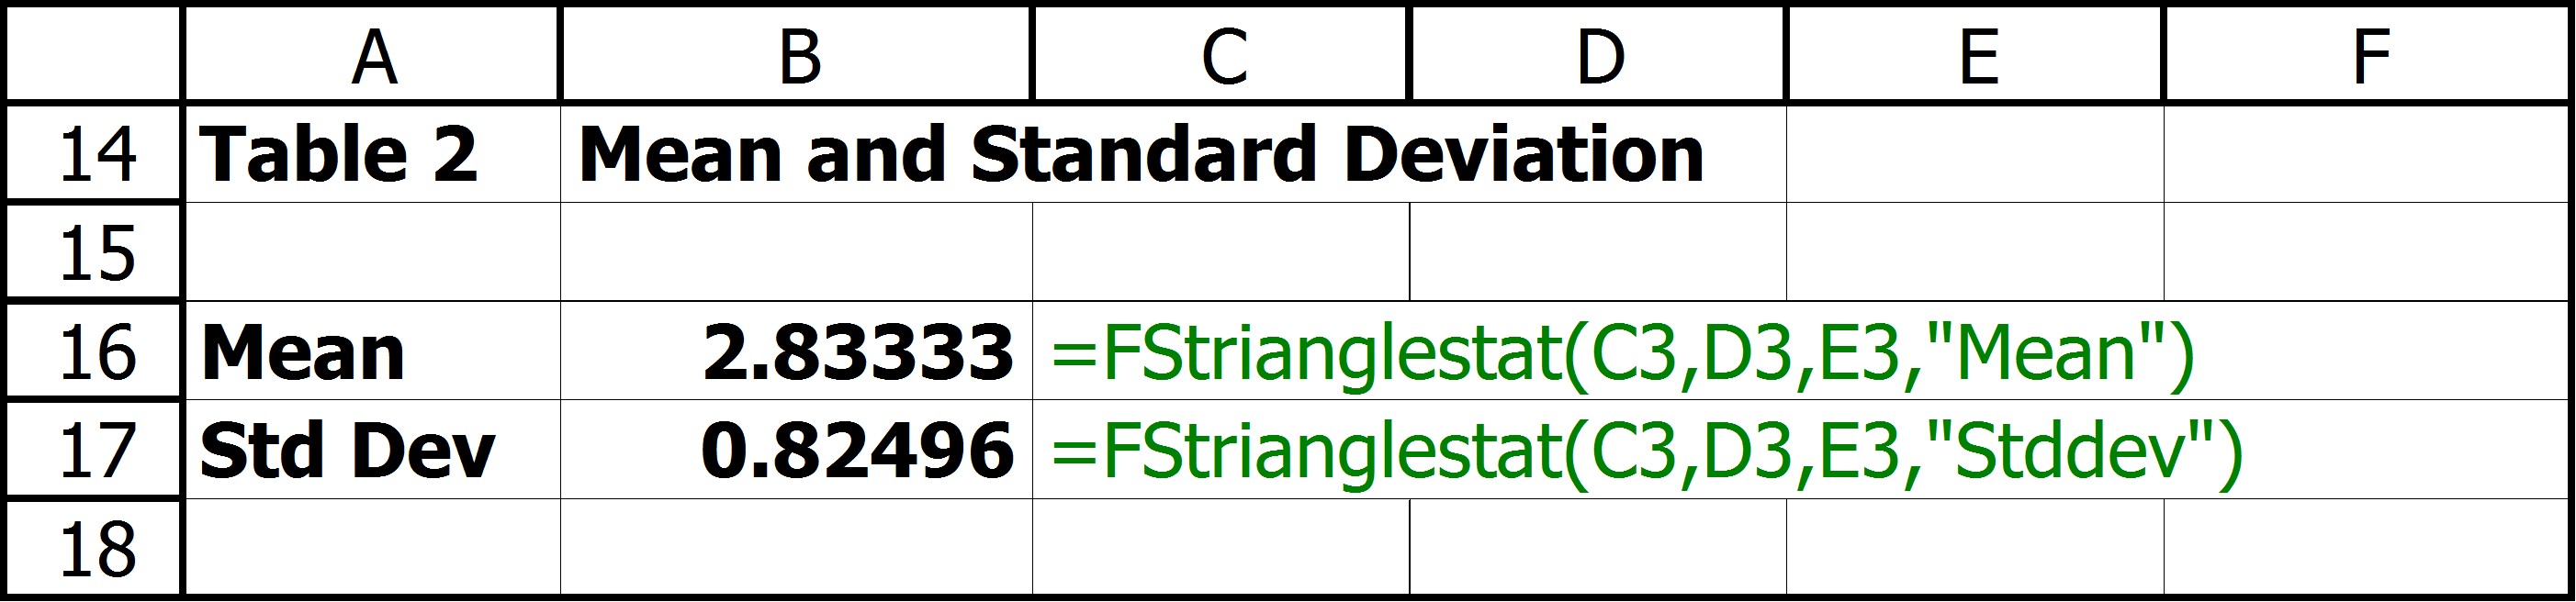
Mean and Standard Deviation for the Triangle Distribution
Frequently the mean of the triangle distribution is not the most likely value. To obtain the mean or standard deviation use:
FSTrianglestat(Low, Likely, High, "Code")
The codes are enclosed in quotes are: "mean" to get the mean of the distribution and "stddev" to obtain the standard deviation.
Table 2 shows the results for the inputs in Table 1.
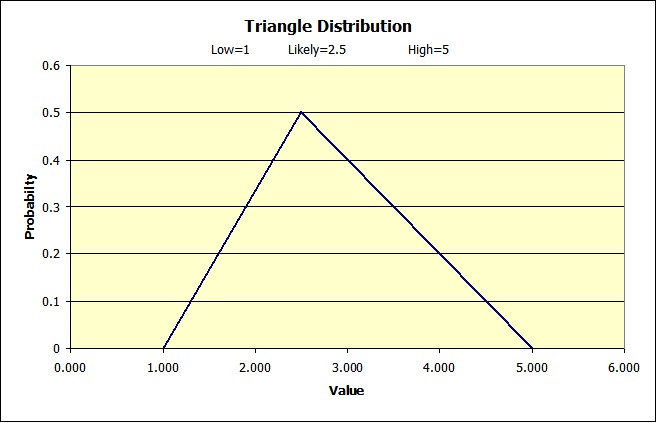
What does this distribution look like? First the density function looks as you might expect a triangle.
The cumulative density function does not look like a triangle.
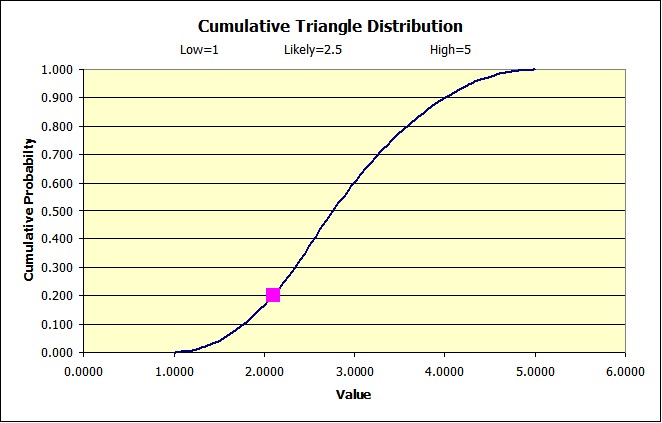
In this case the rose square represents a random number equal to .20 and therefore a value for this distribution at this point of 2.0954.
1 The computations in the function are based on a method suggested by: Rick Hesse, "Triangle Distribution: Mathematica link for Excel", Decision Line, May, 2000
Copyright © 2009 Pieter Vandenberg