Simple Correlation
FSCorrand(Correlation Coefficient, Random Number, Optional 2nd Random Number)
This function returns a random number that is correlated with the first random number with an average correlation coefficient given by the first input (remember this is on average so don't be "surprised" by a single value).
The first two inputs are required, the third input is optional. The function calculated the the correlated random number effectively using a Choleskey decomposition, although given only two variables it used a simplified formula to do the calculation. This formula requires the first random number (actually it can be any number for which you want a correlated random number) and then uses a second random number to calculated a correlated random number. The user therefore can control the second random number if they wish, this may be useful if the "randseq" option is being used. Given the same sequence of random number FSCorrand will always return the same sequence of correlated random numbers.
Example:
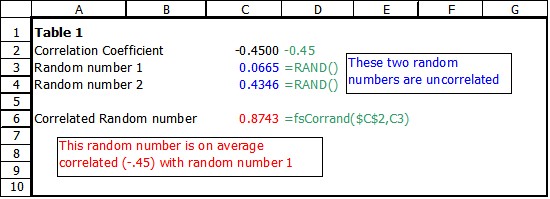
A firm's Total Revenue (TR) = Price*Quantity (P*Q). It is also well known that the relationship between price and quantity is inverse. Table 1 below shows a situation where random numbers are calculated to be used in a simulation of TR for a firm (thegreen text shows the formula in the cell to the left).
Notice the random numbers in rows 2 and 3 are uncorrelated. If they weren't the Excel random number function {Rand()} would not be doing its job! In row 6 a random number that is -.45 correlated with Random number 1 is created using the FSCorrand() function. Notice that the optional section random number is not supplied so the function will supply one since it is needed to produce the result. Table 2 shows how these could be used.
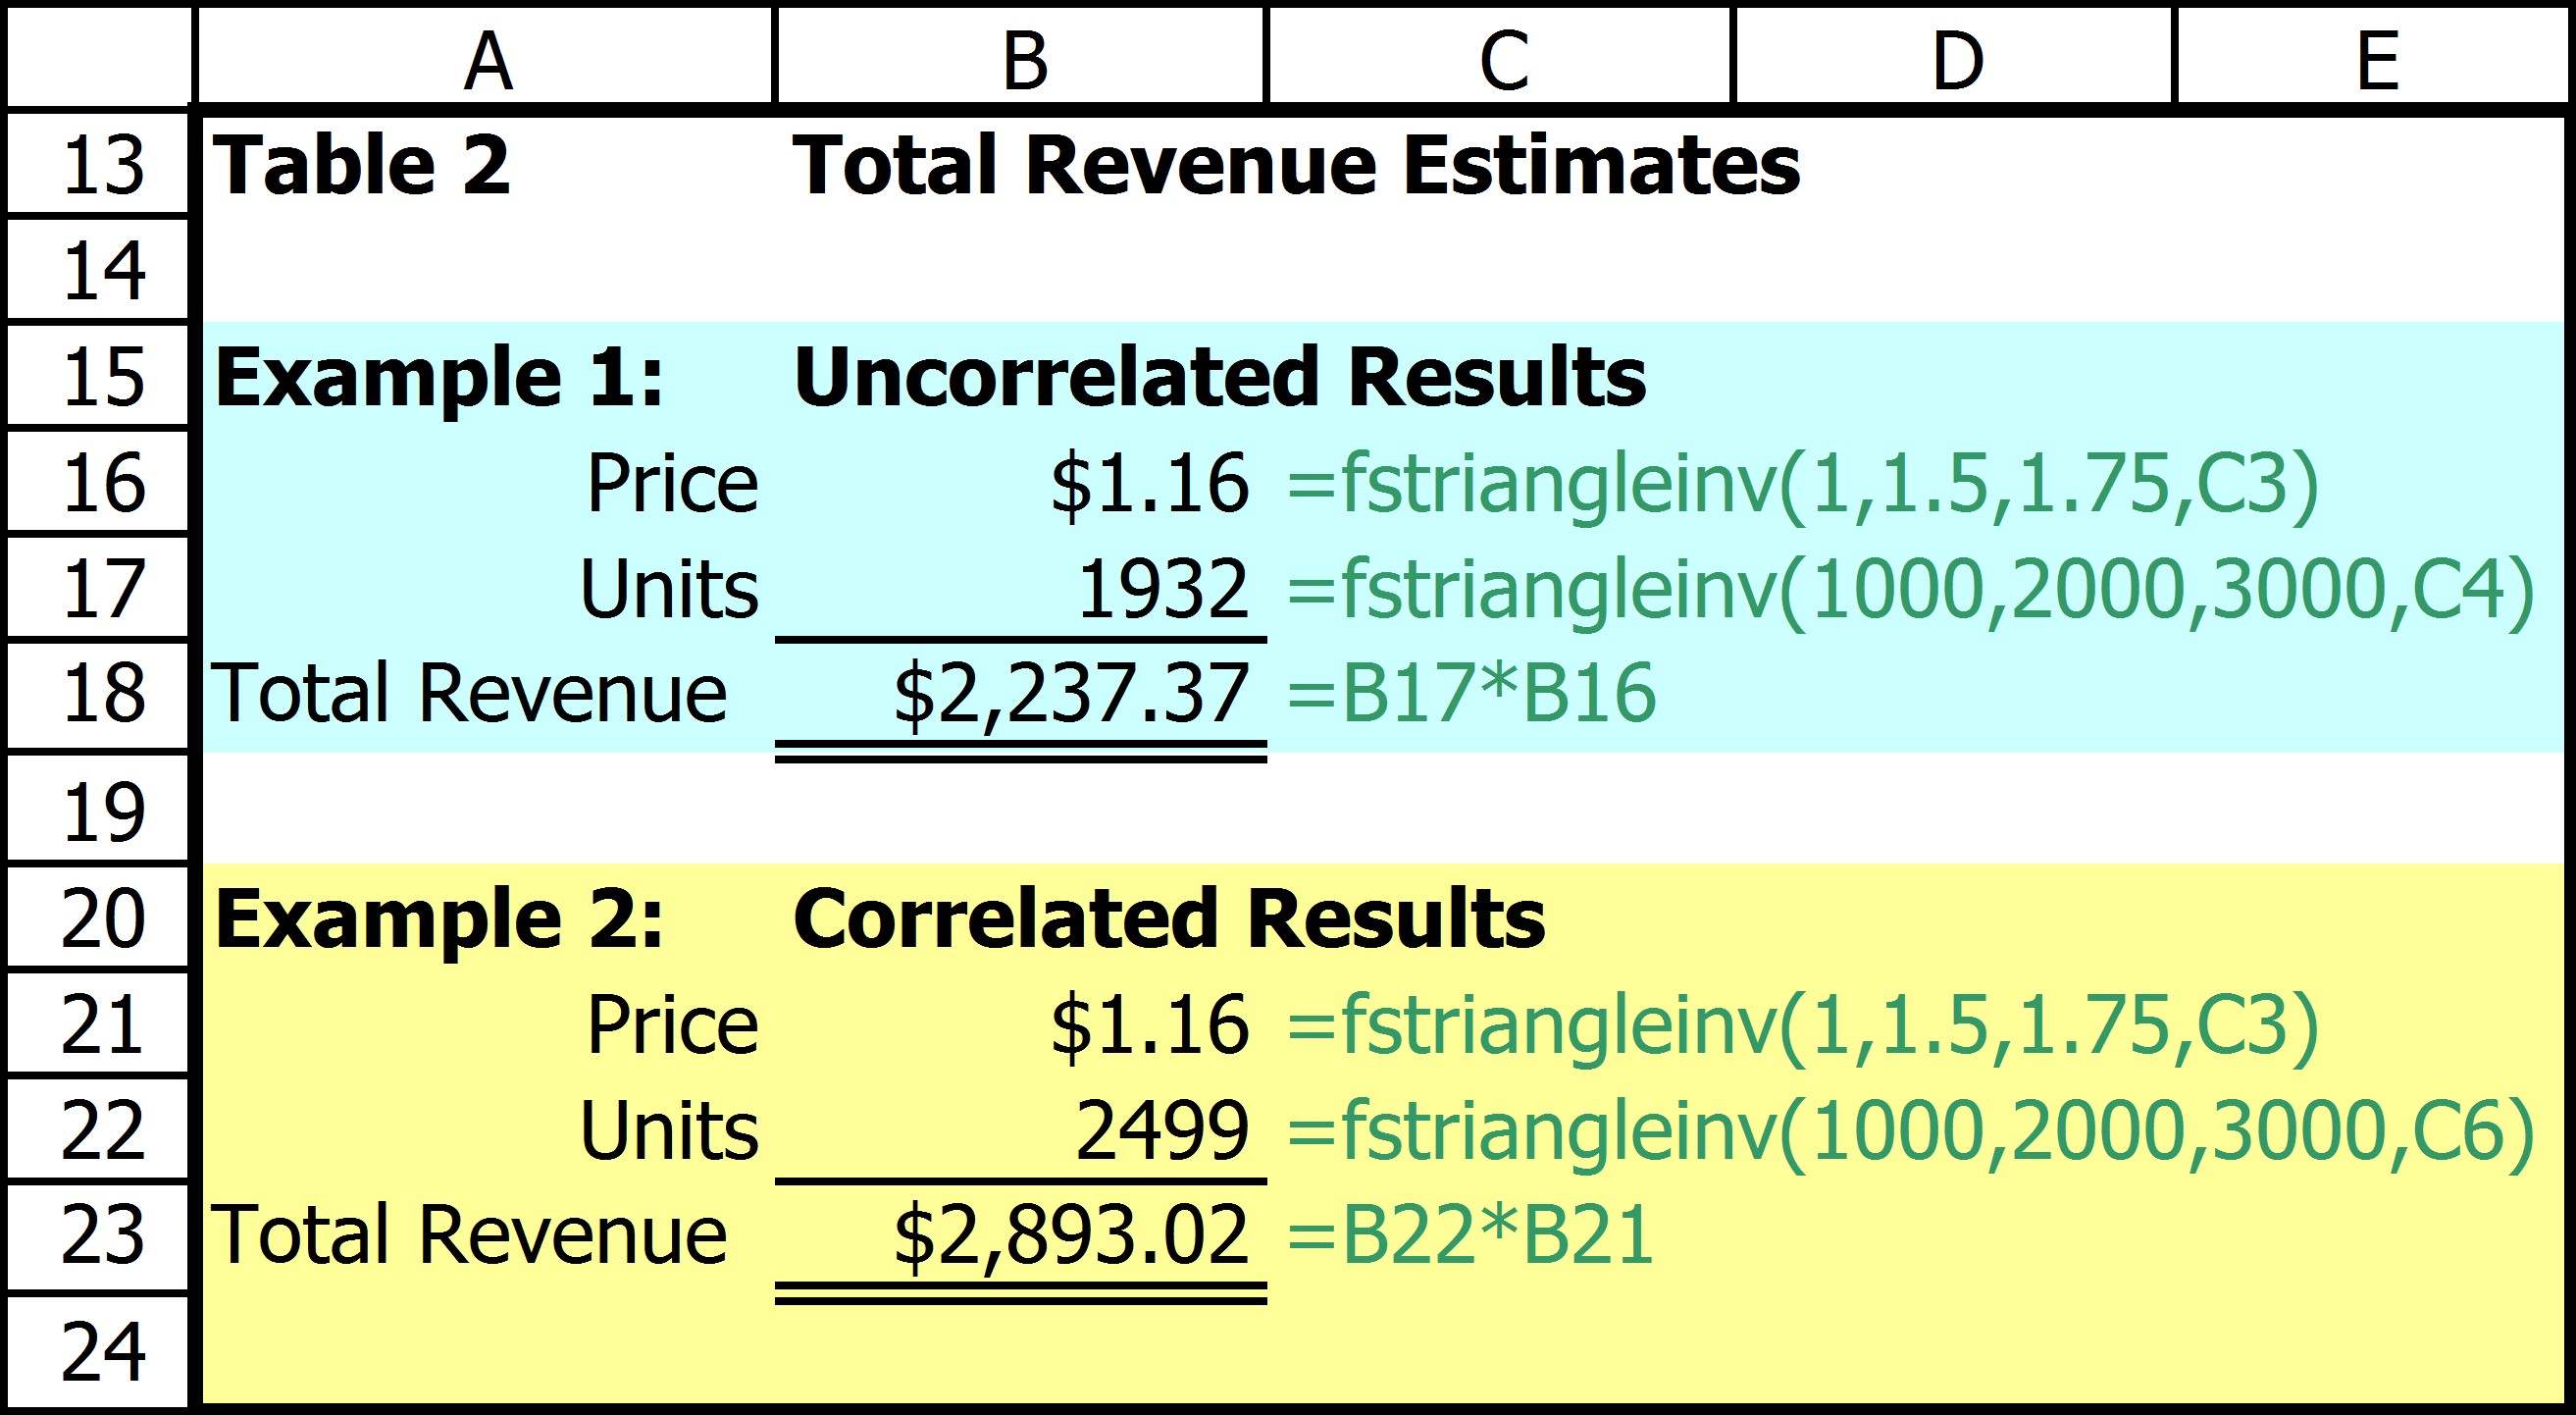
In Example 1 TR is simulated assuming price and quantity are independent. They are both simulated using a triangle distribution, for price the low value is $1.00, most likely is $1.50 and the high value is $1.75. For units the respective values are 1000, 2000, and 3000. Notice that the two independent random numbers from Table 1 are used. In example 2 the same distributions are used but notice that it uses the correlated random number. In this result Price is relatively low in Example 1 this is not considered, but in Example 2 quantity is significantly higher to reflect this.
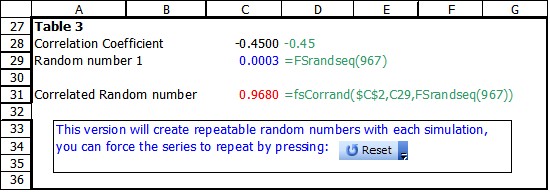
Table 3 shows how a set of repeatable simulations could be created through the use of FSRanseq(seed). Each time the simulation is run or reset is pressed the sequence of random numbers repeat. This would make it easy to test the effect of changing one (or more) of the input parameters, perhaps the distribution of price to say $1.25, $1.65, and $1.95 respectively.
Copyright © 2009 Pieter Vandenberg